
Analytics
Simple, good looking & friendly
Most web analytics solutions do way too much when, in most cases, what you need is to glance over them and easily understand what is going on.
Simple 5-min installation process
Easy to understand & use
Modern & good looking
Dashboard
Everything at just a glance
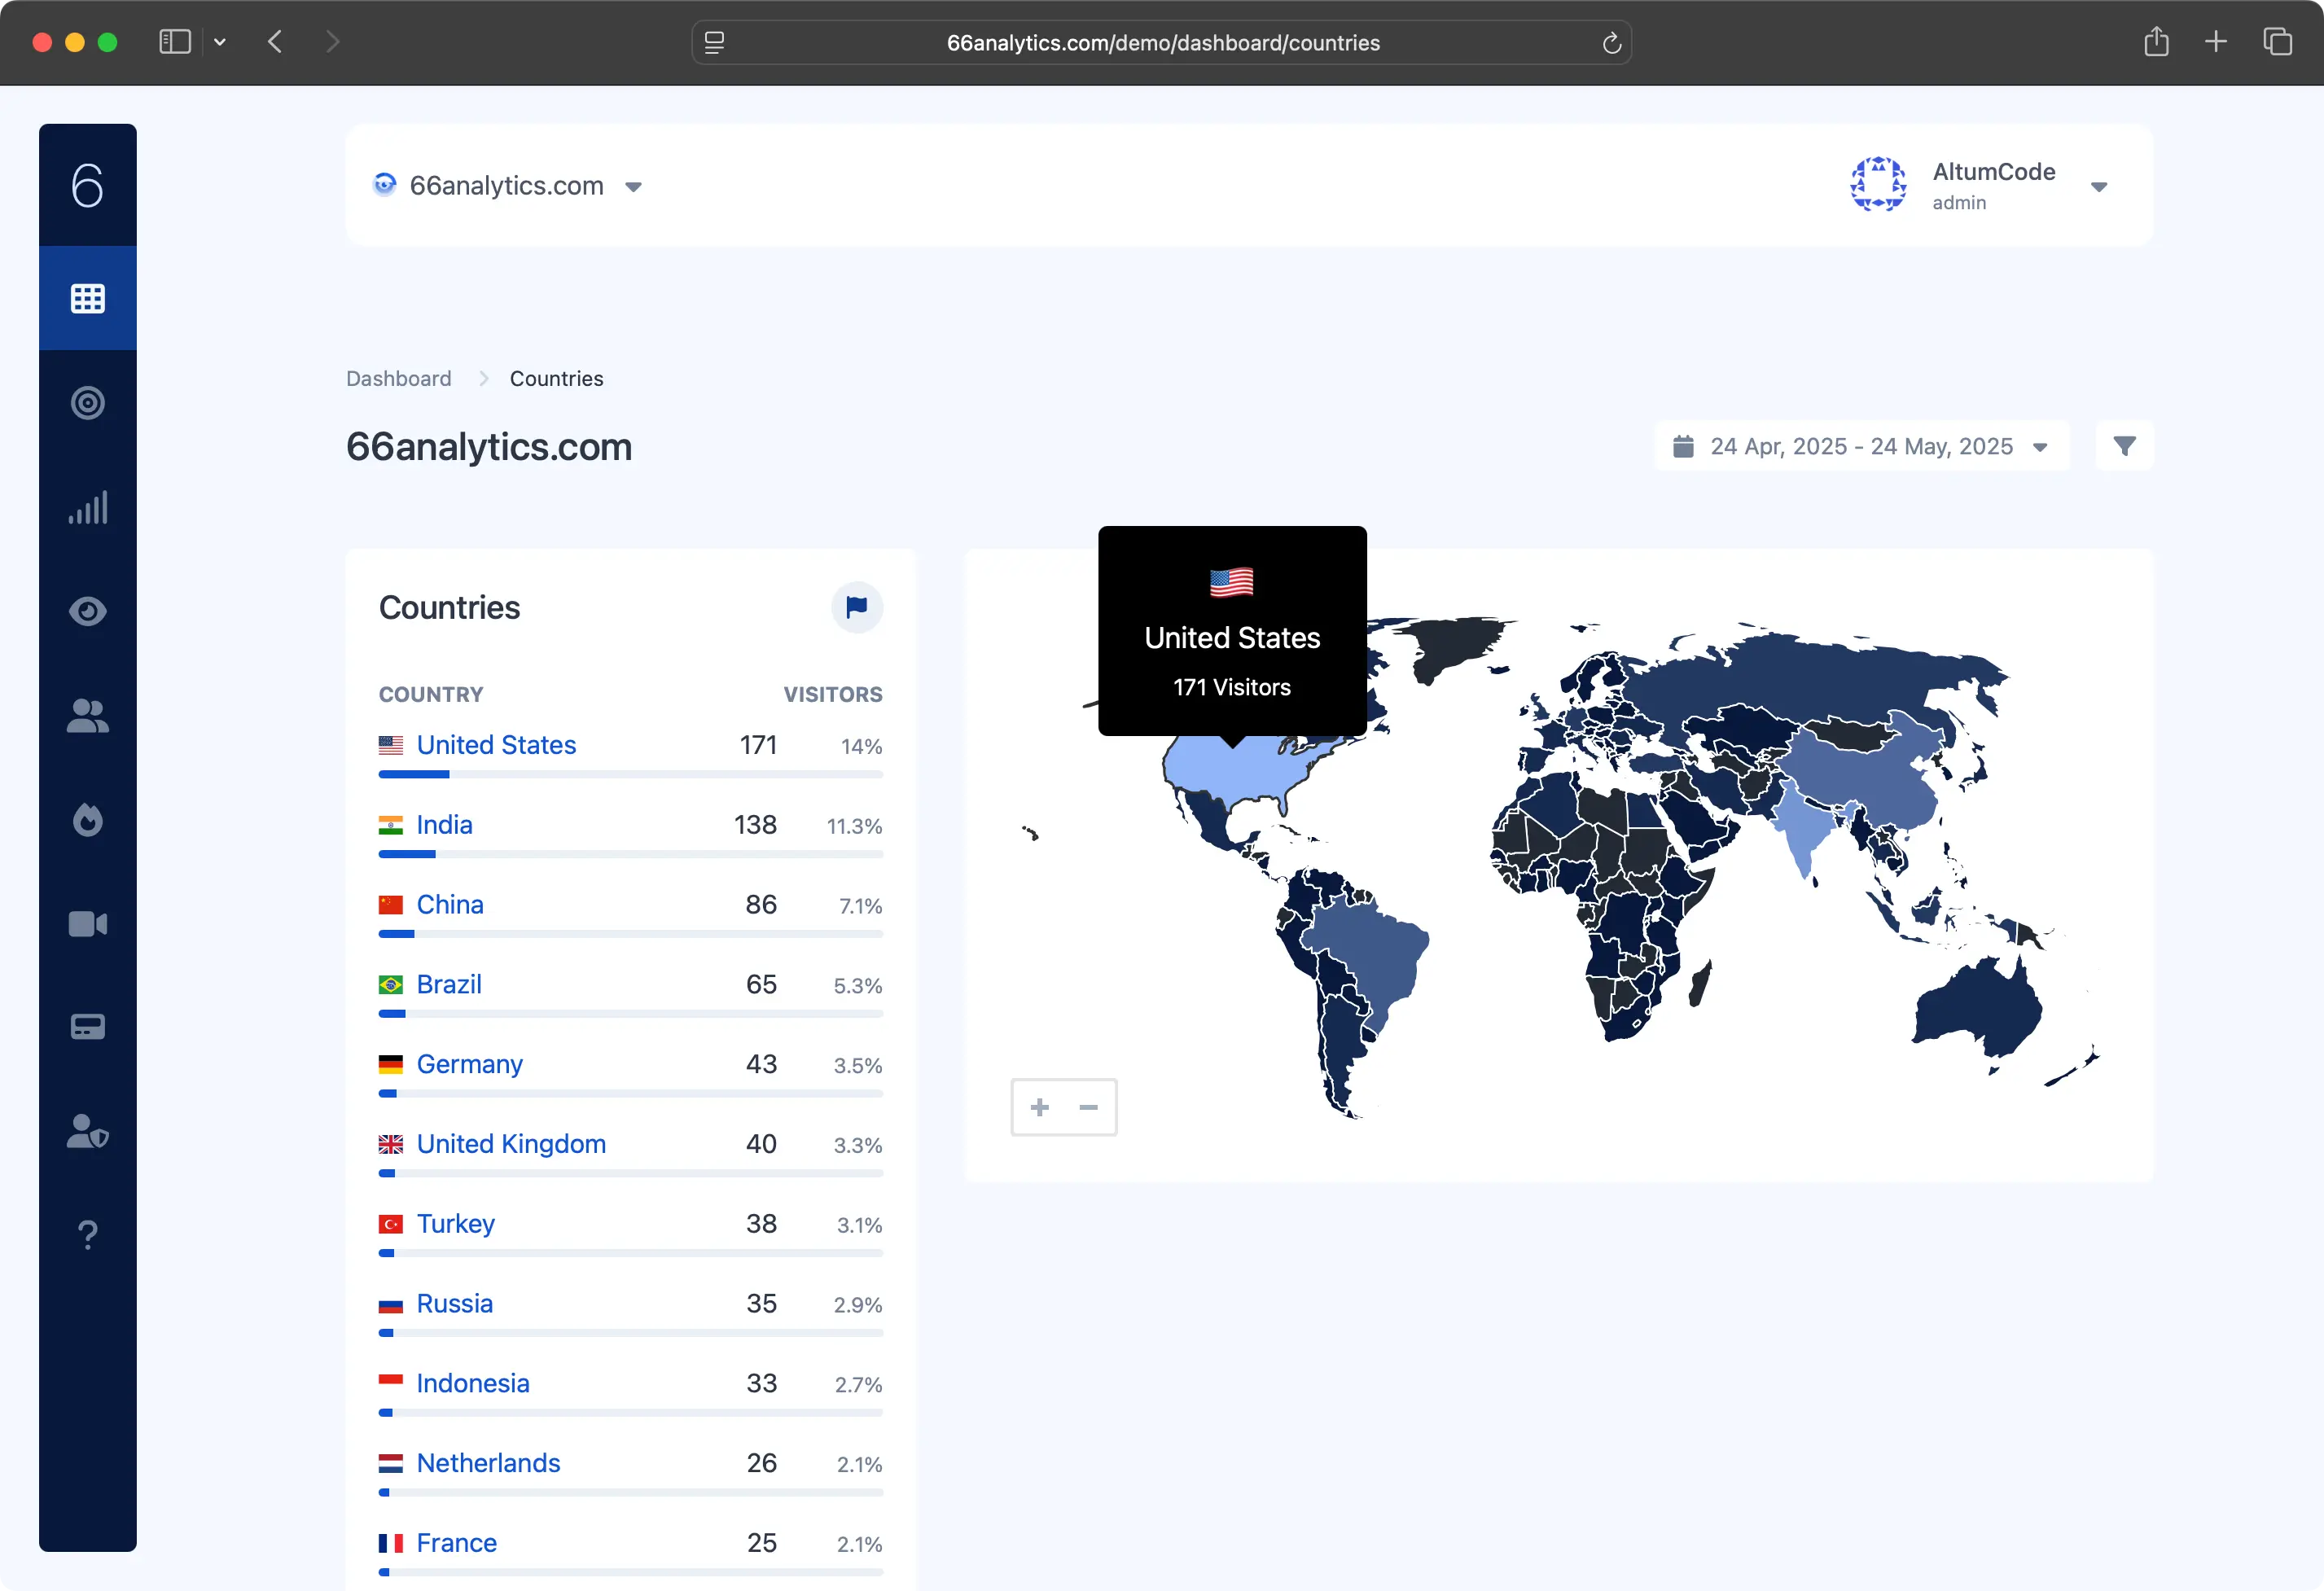
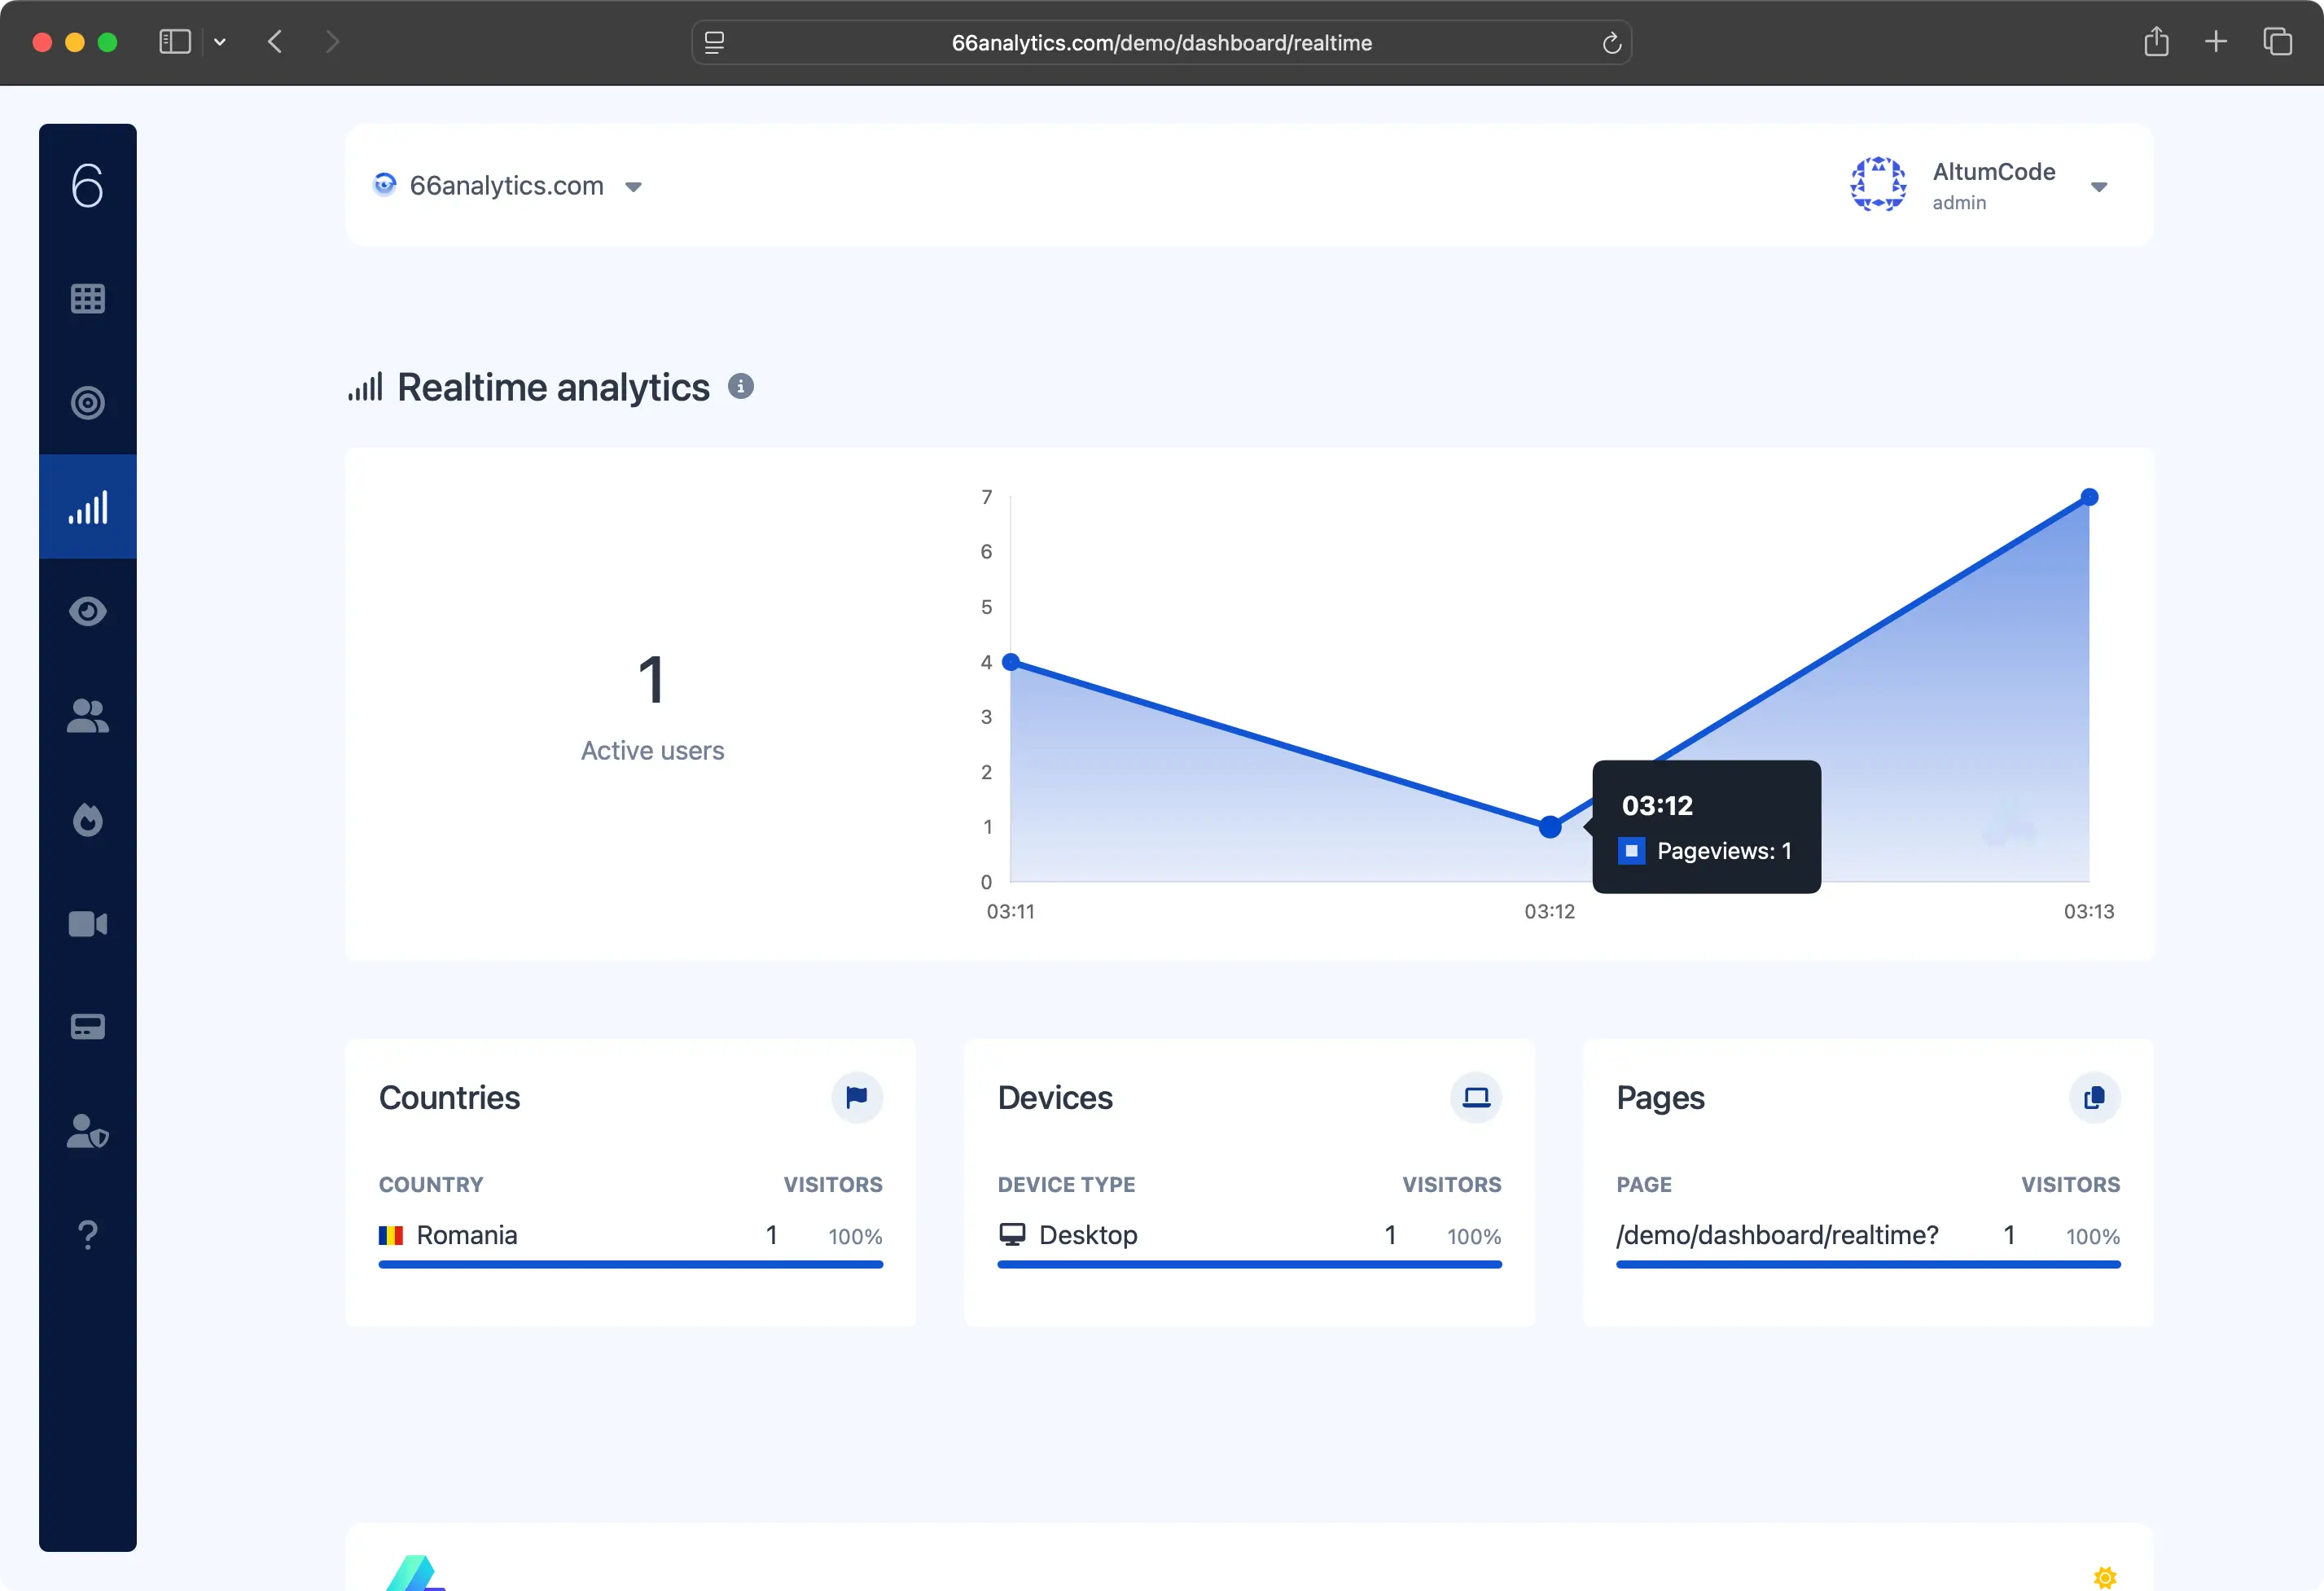
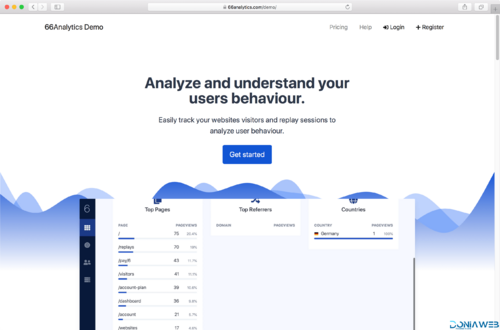
The dashboard contains all the details you will need to know how you traffic is looking and evolving.
Evolution on the past days, months or years
Top pages, countries, referrers
UTM parameters tracking
Simple & custom Goals tracking
Cities, devices, OS & browsers statistics
Visitors
Understand your visitors
Evaluating your visitors behaviour and repeated actions is the best way to know what is working and what is not going so well.
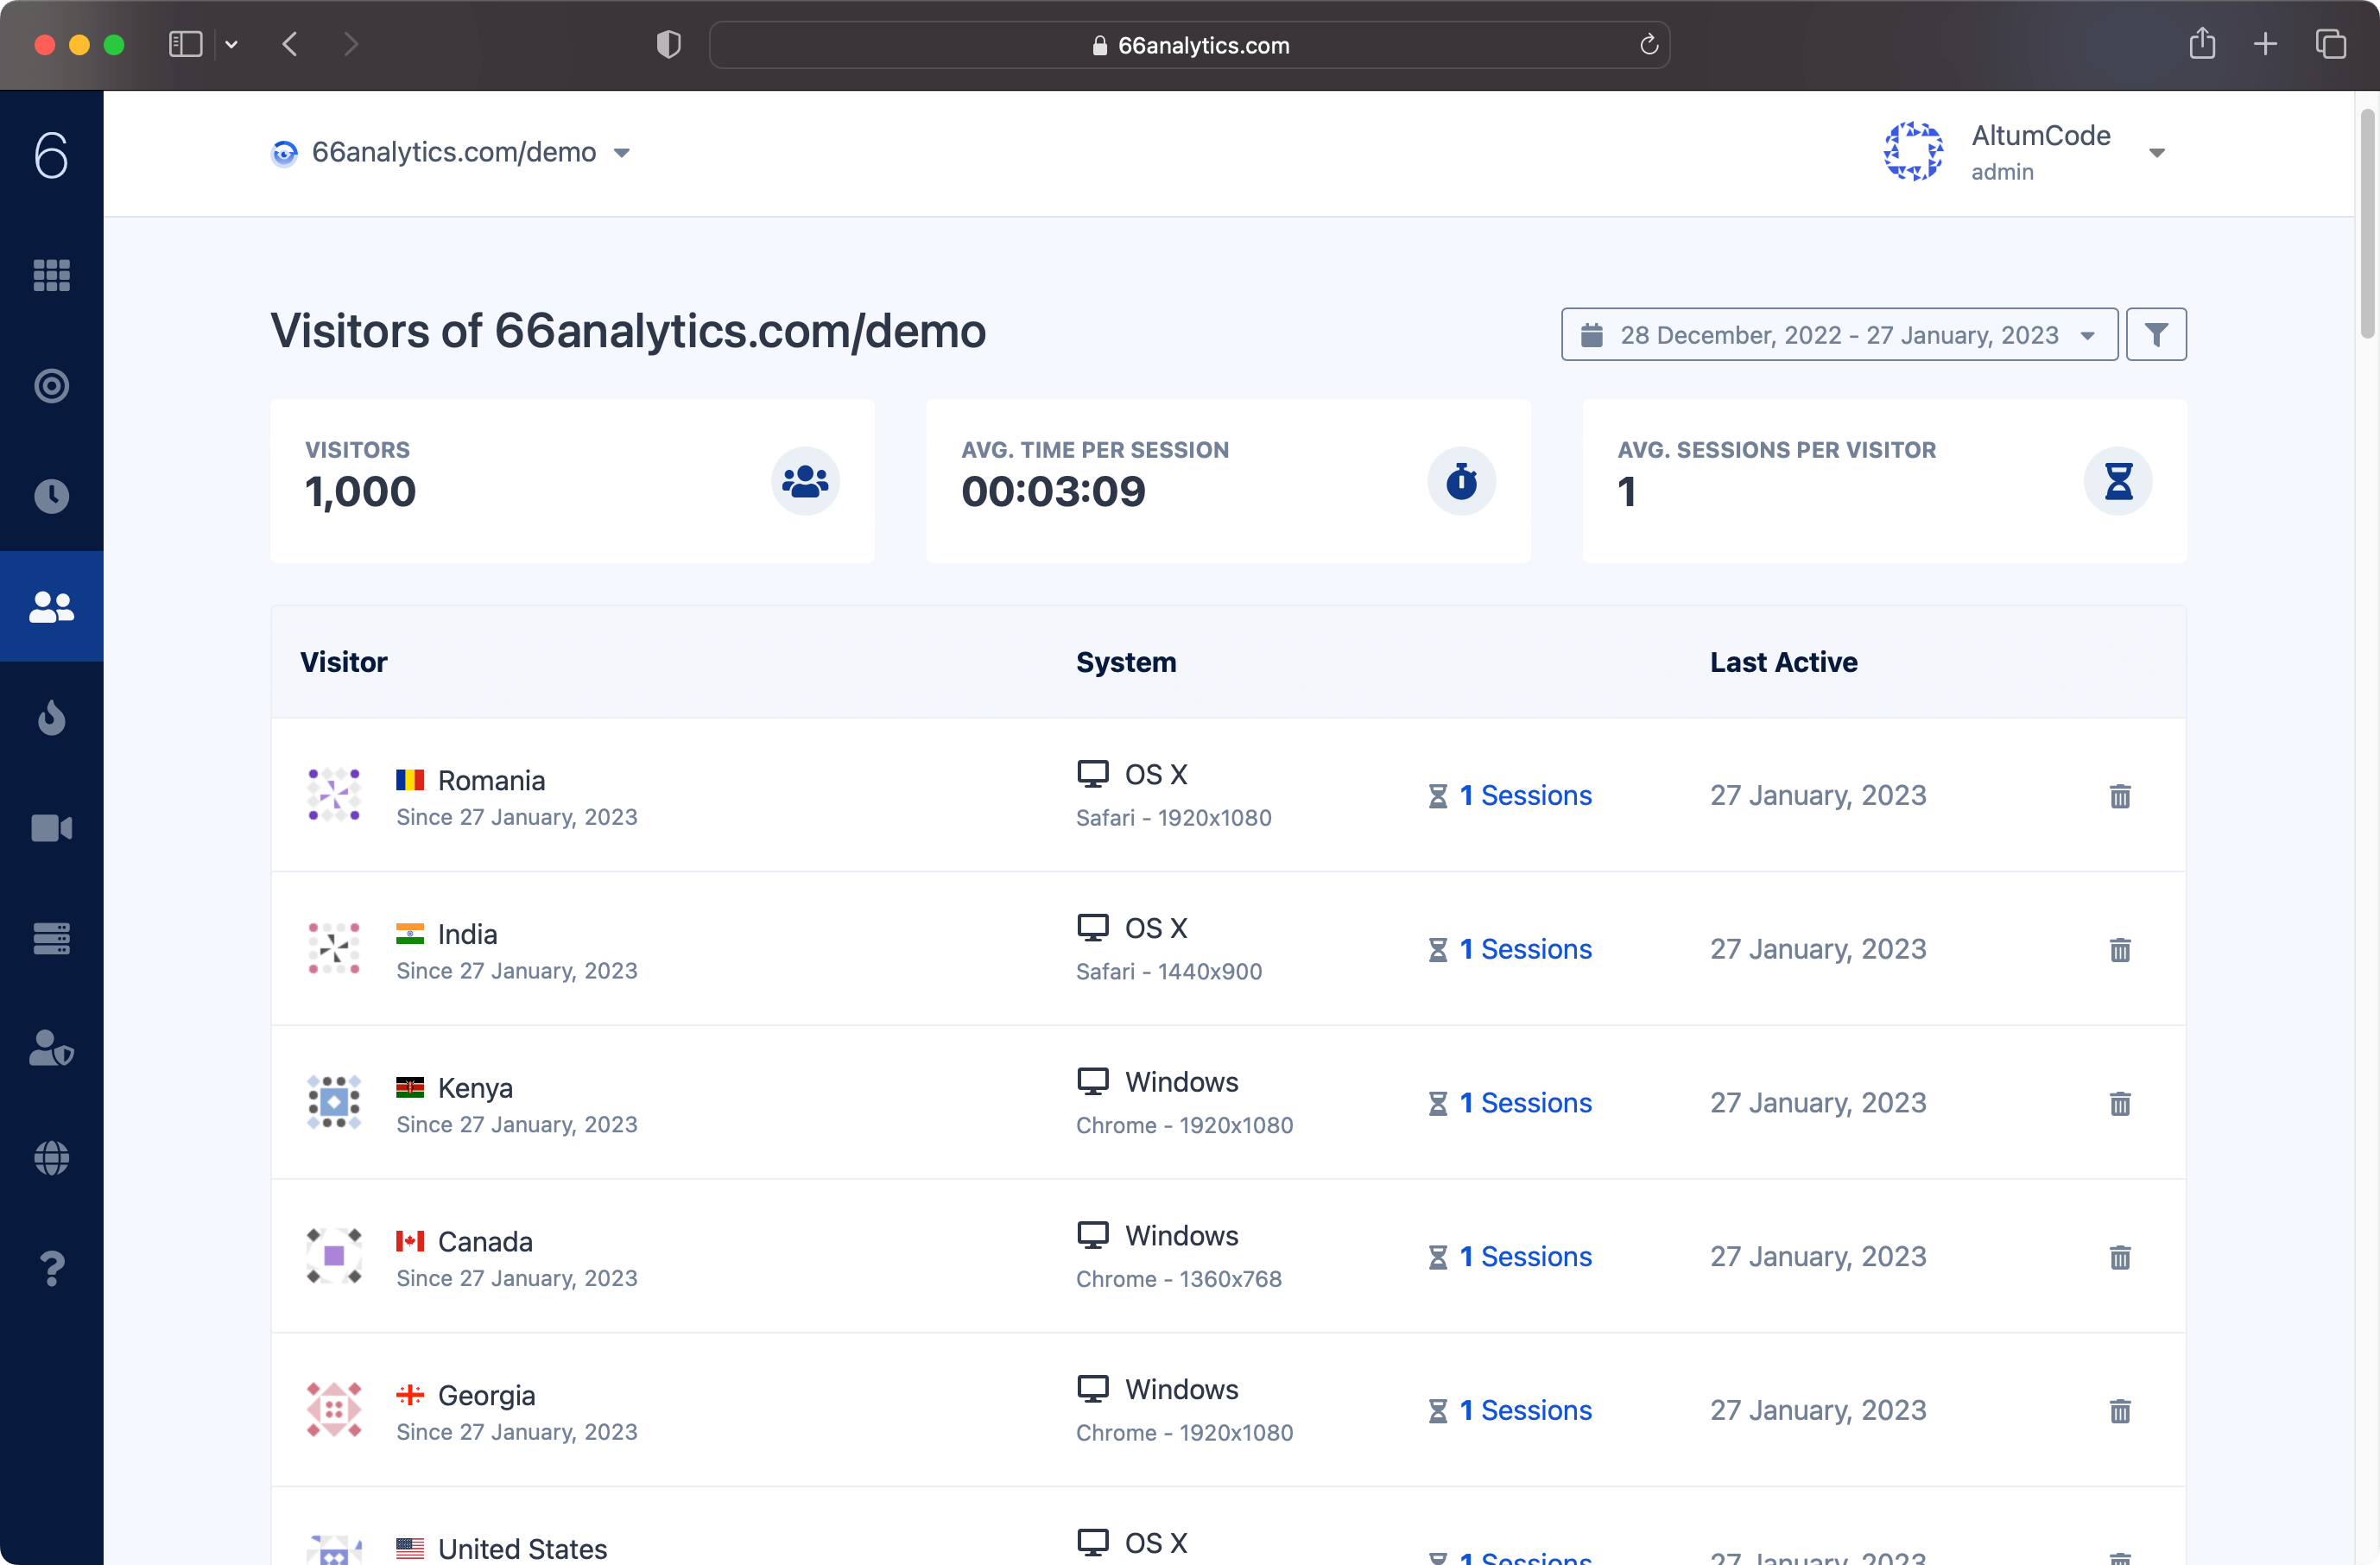
View and get details of all the visitors
Analyze all their past sessionsincluding the flow of the visited pages and their actions
Identify your visitorsIntegration to link your customers with the tracked sessions
BETA
Session replays
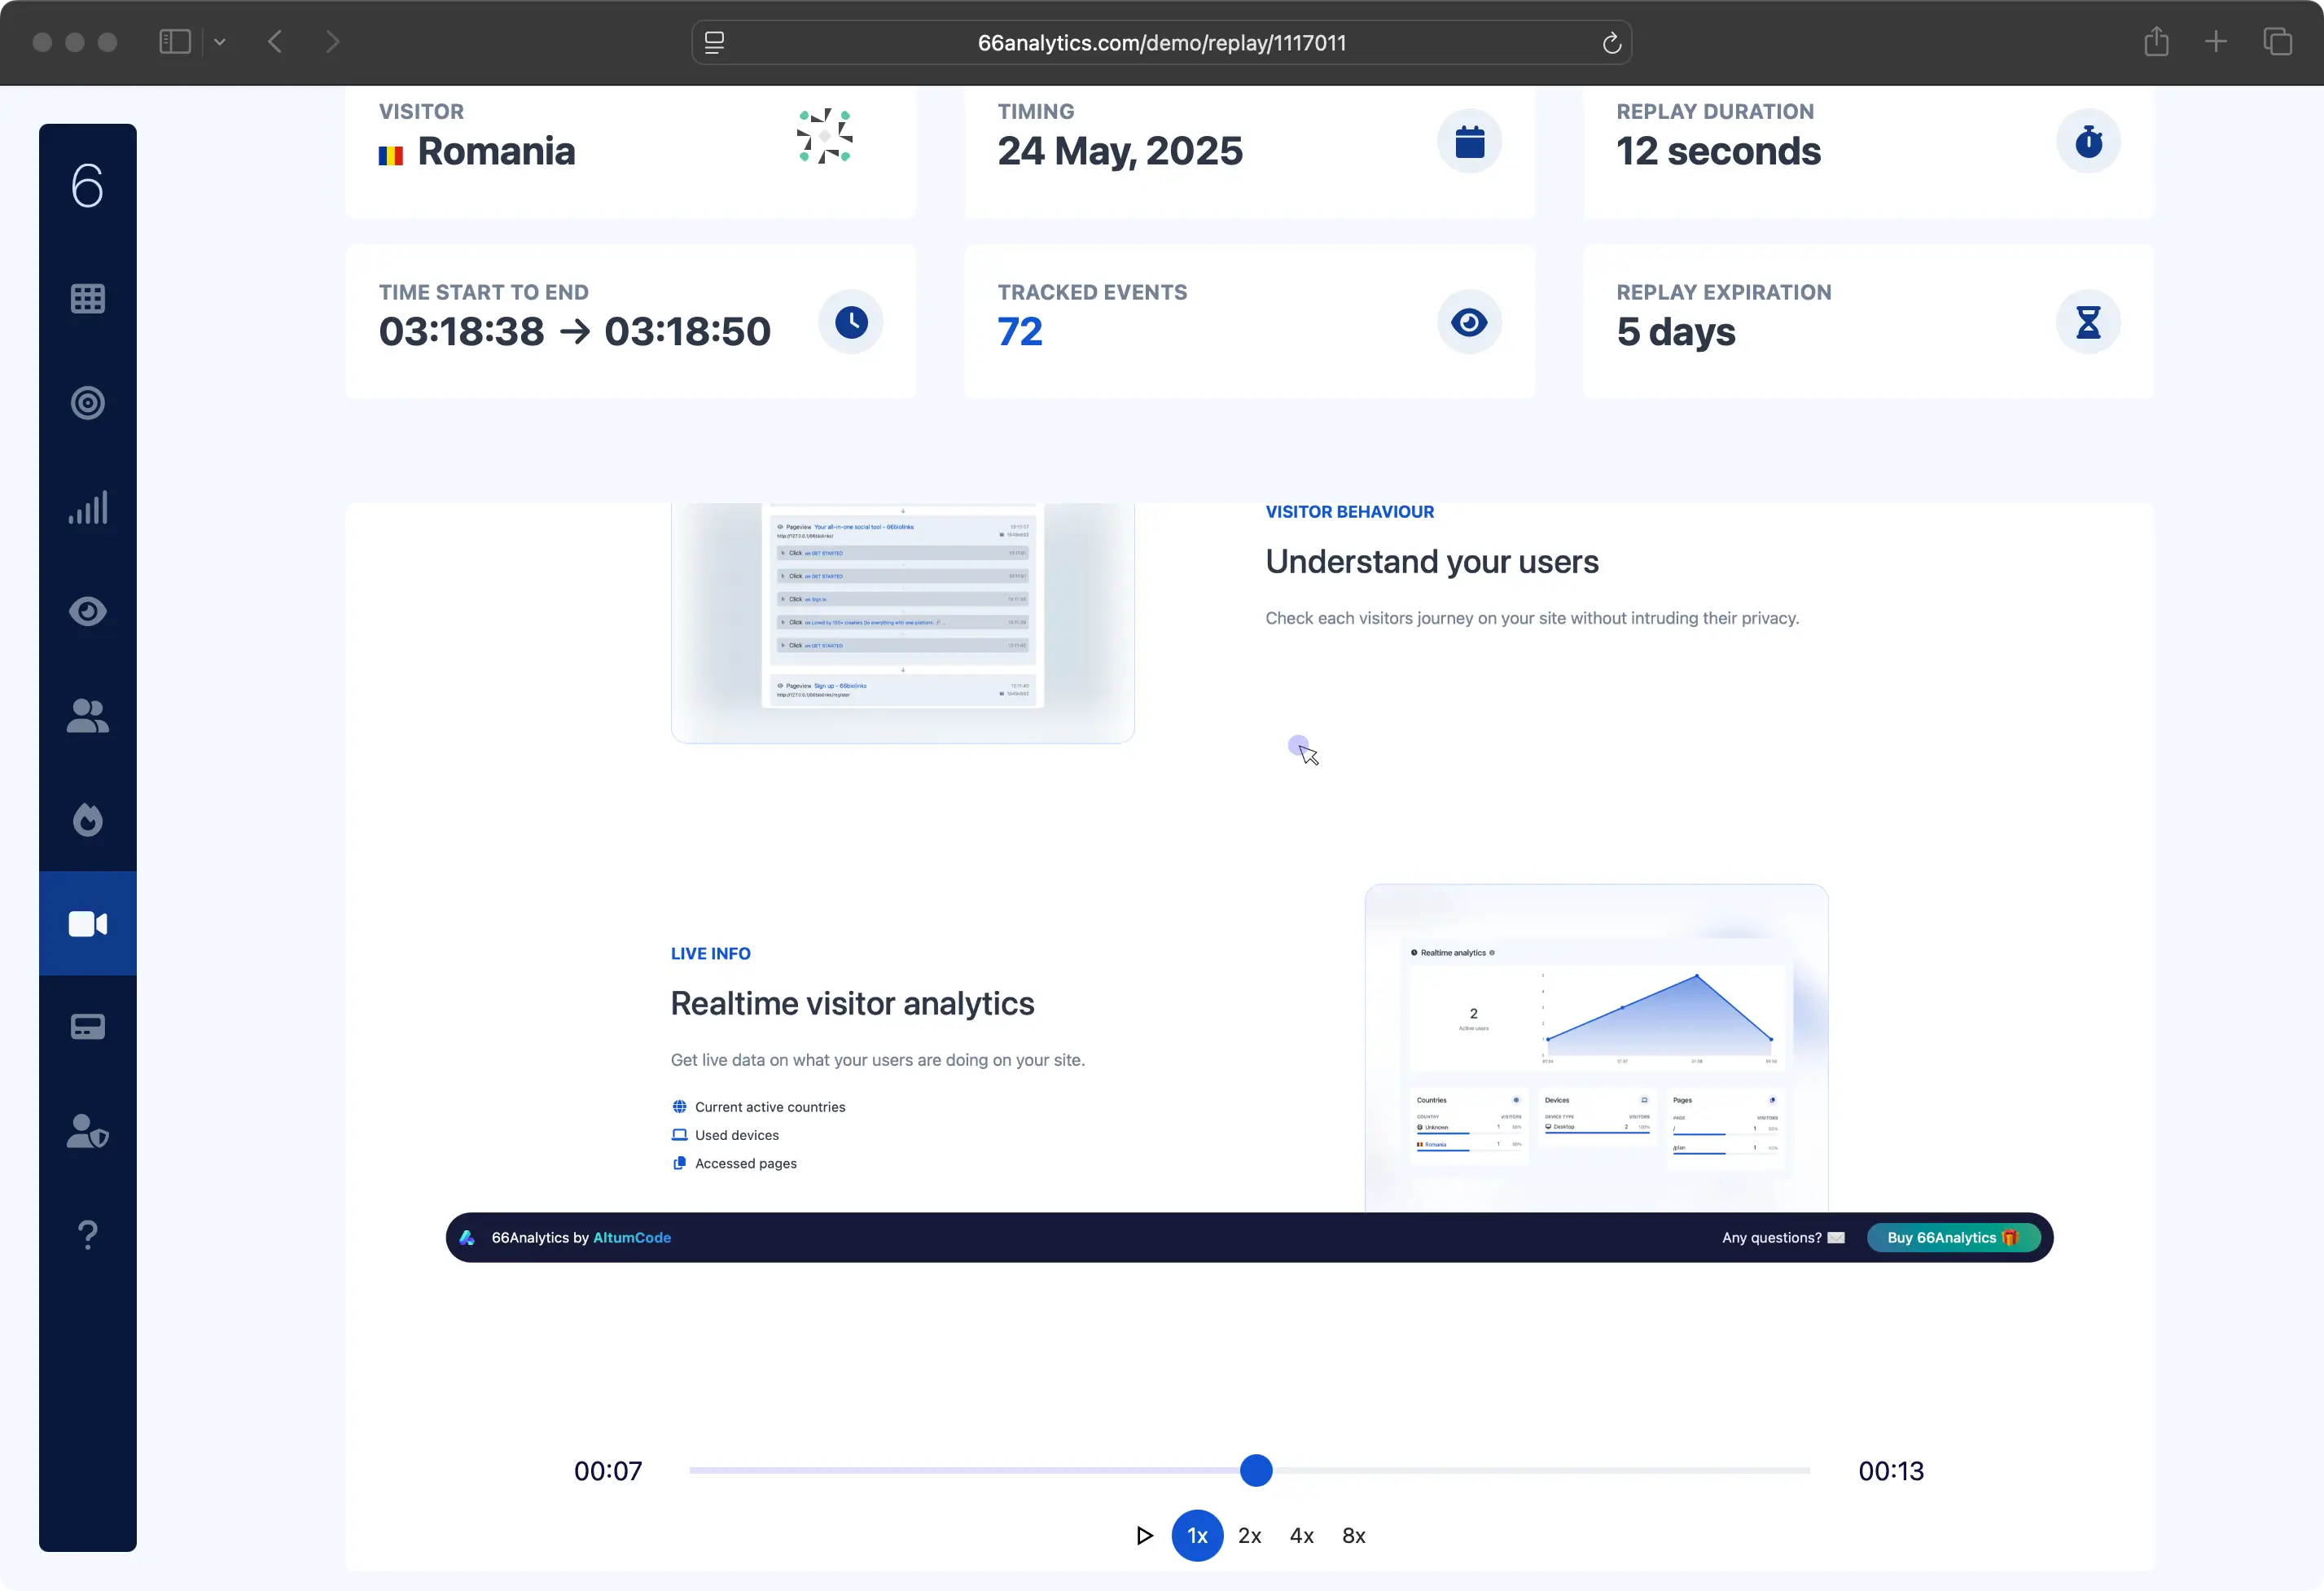
Session replays are the most convenient way to easily check what a visitor did and his journey throughout the site.
Pro - High quality visual replays
Con - Can be heavy on the server
High amount of data needs processing & storage.
What's New in Version 5.1.0
Released
Update 5.1.0 - 26 April, 2021
- Implemented the ability to set a text & background color for announcement messages in the admin panel.
- Implemented the ability to upload a custom Opengraph image for the index directly from the admin panel.
- Fixed statistics email reports bug.
- Fixed admin panel plan creation bug.
- Fixed dashboard statistics filtering bug.
- v41.0.0
-
v39.0.0
-
v38.0.0
-
v37.0.0
-
v36.0.0
-
v35.0.1
-
v33.0.0
-
v30.0.0
-
v29.0.0
-
v28.0.0
-
v27.0.0
-
v26.0.0
-
v25.0.0
-
v23.0.0
-
v20.0.0
-
v19.0.0
-
18.0.0
-
17.0.0
-
16.0.0
-
15.0.0
-
14.0.0
-
14.0.0
-
14.0.0
-
14.0.0
-
13.1.0
-
11.0.0
-
11.0.0
-
10.0.0
-
8.0.0
-
8.0.0
-
7.1.0
-
7.0.0
-
6.3.0
-
6.2.0
-
6.0.0
-
5.1.0
-
4.2.0
-
4.1.0
-
4.0.0
-
3.1.0
-
3.1.0
-
3.0.0
-
2.0.0
-
2.0.0
-
1.4.1
-
1.4.0
-
1.3.1
-
1.3.0
-
1.2.0











.thumb.jpg.2ab3adbf3be038a5475cc8c8ea2460ac.jpg)




You may only provide a review once you have downloaded the file.
There are no reviews to display.